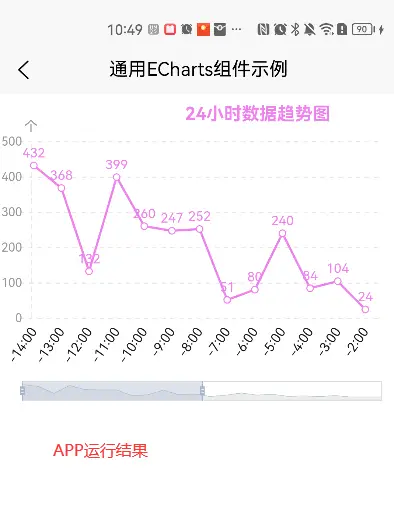
echarts点击事件函数 echartClick(e)说明:
该函数返回echarts点击事件一致的参数,示例如下:
{
 "componentType":"series",
 "componentSubType":"line",
 "componentIndex":0,
 "seriesType":"line",
 "seriesIndex":0,
 "seriesId":"\u0000series\u00000\u00000",
 "seriesName":"series\u00000",
 "name":"-8:00",
 "dataIndex":7,
 "data":323,
 "value":323,
 "color":"#EE82EE",
 "dimensionNames":[
     "x",
     "y"
 ],
 "encode":{
     "x":[
         0
     ],
     "y":[
         1
     ]
 },
 "$vars":[
     "seriesName",
     "name",
     "value"
 ],
 "type":"click"
}
注意事项、注意事项、注意事项
1、导入插件后请将插件中的echarts.js文件复制一份到你的项目static目录下;
2、也可以自行从echarts官网(https://echarts.apache.org/zh/builder.html)构建你的echarts.js文件替换插件的echarts.js文件
3、点击HBuilderX预览,点击事件失效问题,在项目main.js中最底下添加如下代码:
// #ifdef H5
window.wx = {}
// #endif
使用示例
<template>
    <view class="uni-column">
        <view class="charts-box">
            <jushiEcharts :option="option" @onEchartsComplete="onEchartsComplete" @echartClick="echartClick"></jushiEcharts>
        </view>
    </view>
</template>

<script>
    import jushiEcharts from '@/uni_modules/jushi-uniECharts/components/jushi-echarts.vue'
    export default {
        components: {
            jushiEcharts
        },
        data() {
            return {
                option: {}
            }
        },
        onLoad() {

        },
        created() {
            this.$nextTick(() => {
                setTimeout(()=>{
                    // this.getData()
                },1000)
            })
        },
        methods: {
            onEchartsComplete(){//echarts初始化完成回调
                this.getData()
            },
            echartClick(e){//echarts点击事件
                console.log(e.dataIndex)
            },
            getData() {
                var date = new Date()
                var hour = date.getHours()
                let xArr = []
                let dArr = []
                for (var i = 1; i <= 24; i++) {
                    xArr.push((hour - i) + ':00')
                    dArr.push(i * (Math.floor(Math.random() * 20 + 1)))
                }
                let xData = ['12:00', '13:00', '14:00']
                let datas = [99, 66, 88]
                this.option = this.getOption(xArr.reverse(), dArr.reverse())
            },
            getChartData(xData, datas) {
                return {
                    "categories": xData,
                    "series": [{
                        "name": "",
                        "data": datas
                    }]
                }
            },
            getOption(xData, datas) {
                return {
                    title: {
                        text: '24小时数据趋势图',
                        textStyle: {
                            color: '#EE82EE',
                            fontSize: 16
                        },
                        left: '45%',
                        top: '5',
                        bottom: '10'
                    },
                    "tooltip": {
                        "show": true,
                        "trigger": "axis",
                        "axisPointer": {
                            "lineStyle": {
                                "color": "transparent"
                            }
                        }
                    },
                    "grid": {
                        "left": "5%",
                        "top": "15%",
                        "right": "5%",
                        "bottom": "85"
                    },
                    "dataZoom": [{
                            "type": "inside",
                            "start": 0,
                            "end": 50,
                            "zoomLock": true
                        },
                        {
                            "type": "slider",
                            "start": 0,
                            "end": 50,
                            "zoomLock": true,
                            "bottom": "10",
                            "height": 18,
                            "brushSelect": false,
                            "showDetail": false
                        }
                    ],
                    "xAxis": [{
                        "type": "category",
                        "data": xData,
                        axisTick: {
                            show: false
                        },
                        axisLine: {
                            show: false,
                            lineStyle: {
                                color: '#6A989E',
                            }
                        },
                        axisLabel: {
                            inside: false,
                            textStyle: {
                                color: '#1a1a1a', // x轴颜色
                                fontWeight: 'normal',
                                fontSize: 12,
                                lineHeight: 22
                            },
                            interval: 0,
                            rotate: 55,
                            // align: 'right',
                            margin: 10
                        },
                        "boundaryGap": true
                    }],
                    "yAxis": [{
                        "name": "个",
                        "nameGap": 8,
                        "offset": -10,
                        nameTextStyle: {
                            color: '#999999',
                            fontSize: 12
                        },
                        splitLine: {
                            lineStyle: {
                                type: 'dashed',
                                color: 'rgba(135,140,147,0.2)'
                            },
                        },
                        axisLine: {
                            show: true,
                            lineStyle: {
                                type: 'dashed',
                                color: 'rgba(135,140,147,0.2)'
                            }
                        },
                        axisTick: {
                            show: false
                        },
                        axisLabel: {
                            formatter: '{value}',
                            color: '#999999',
                            fontSize: 11
                        }
                    }],
                    "series": [{
                        "symbolSize": 6,
                        "symbol": "emptyCircle",
                        "type": "line",
                        smooth: false, //平滑曲线
                        "yAxisIndex": 0,
                        "data": datas,
                        "itemStyle": {
                            "normal": {
                                "borderWidth": 1,
                                "color": "#EE82EE"
                            }
                        },
                        "label": {
                            "show": true,
                            "position": "top",
                            "distance": 2,
                            "fontSize": 12,
                            "color": "#EE82EE"
                        },
                    }]
                }
            }
        }
    }
</script>

<style>
    .charts-box {
        width: 100%;
        height: 600rpx;
    }
</style>
其它插件
安卓原生插件


 收藏人数:
收藏人数:
 下载插件并导入HBuilderX
 赞赏(2)
赞赏(2)


 下载 921
 赞赏 6
赞赏 6

 下载 8957132
 赞赏 1300


 赞赏
赞赏
 京公网安备:11010802035340号