更新记录
1.0.0(2024-02-04)
下载此版本
1、初次发布
平台兼容性
| App |
快应用 |
微信小程序 |
支付宝小程序 |
百度小程序 |
字节小程序 |
QQ小程序 |
| × |
× |
√ |
× |
× |
× |
× |
| 钉钉小程序 |
快手小程序 |
飞书小程序 |
京东小程序 |
鸿蒙元服务 |
| × |
× |
× |
× |
× |
| H5-Safari |
Android Browser |
微信浏览器(Android) |
QQ浏览器(Android) |
Chrome |
IE |
Edge |
Firefox |
PC-Safari |
| √ |
√ |
√ |
√ |
√ |
√ |
√ |
√ |
√ |
简介
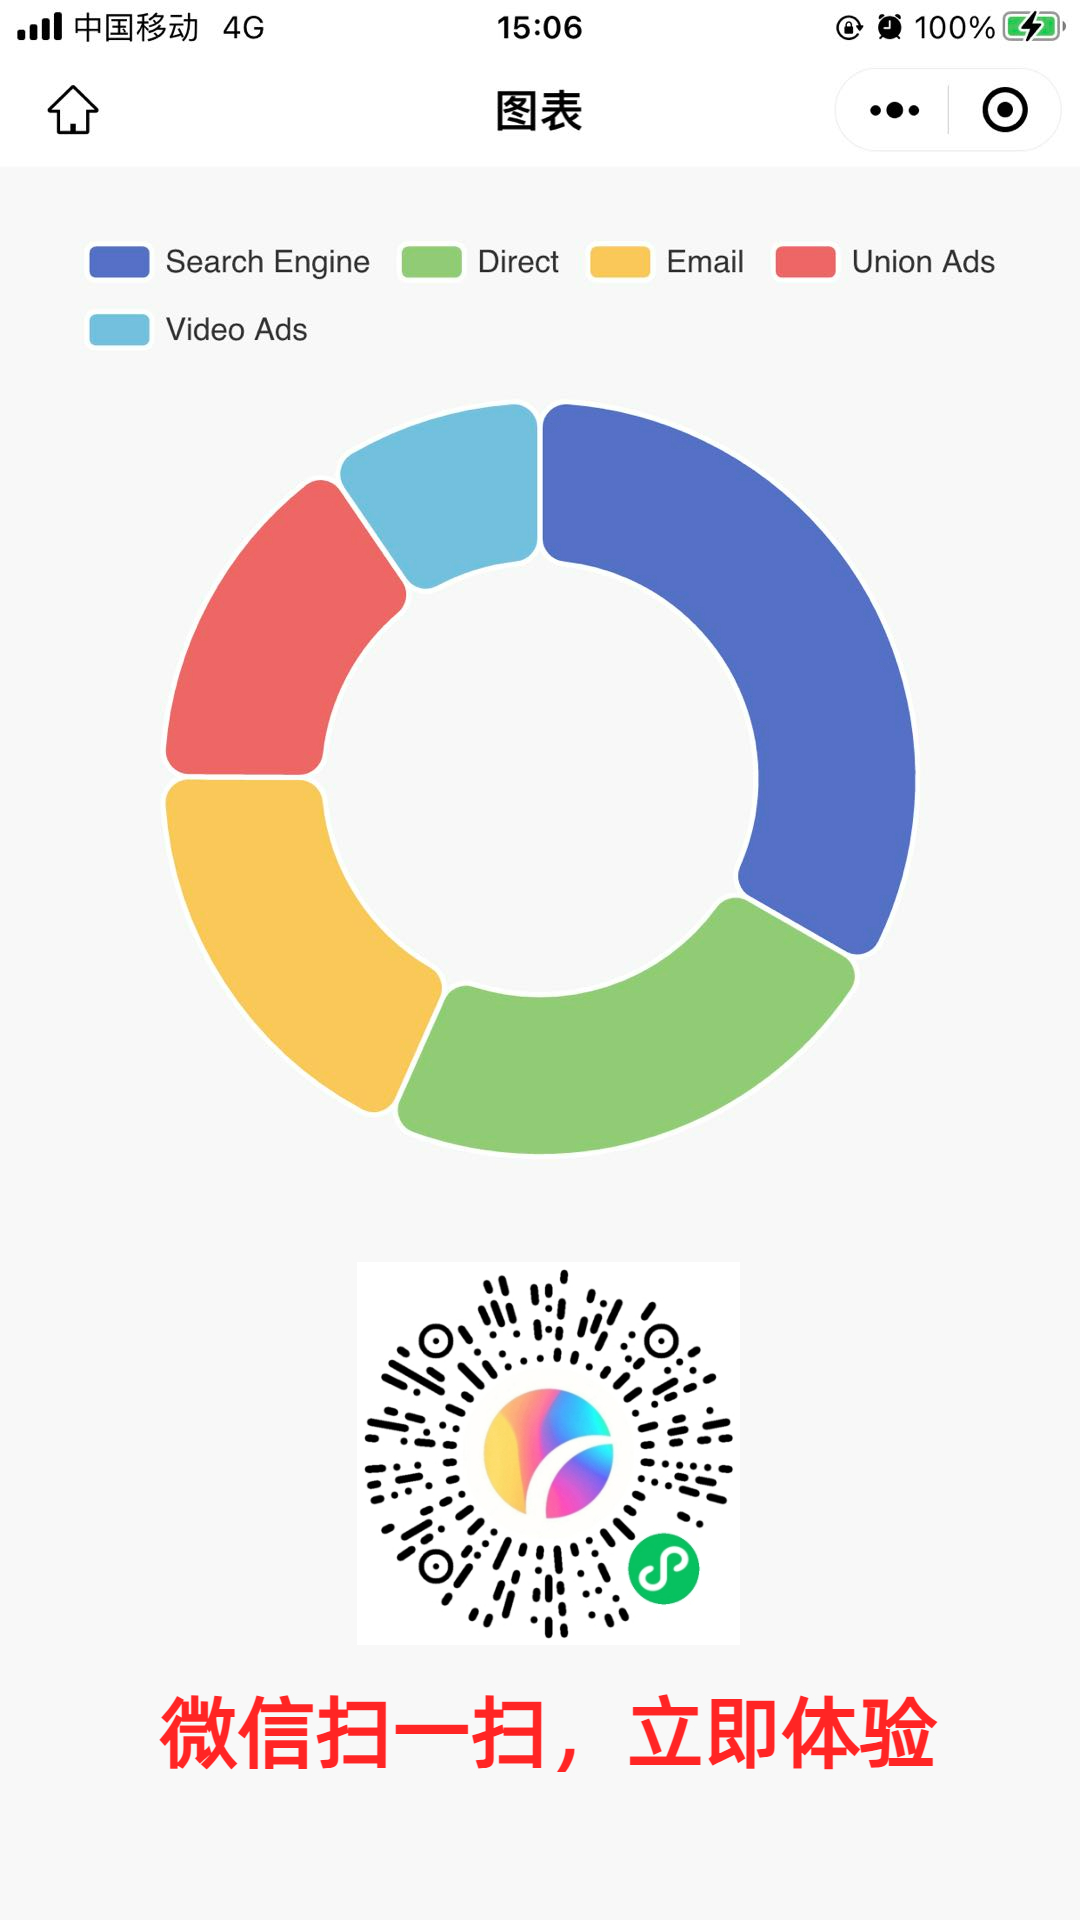
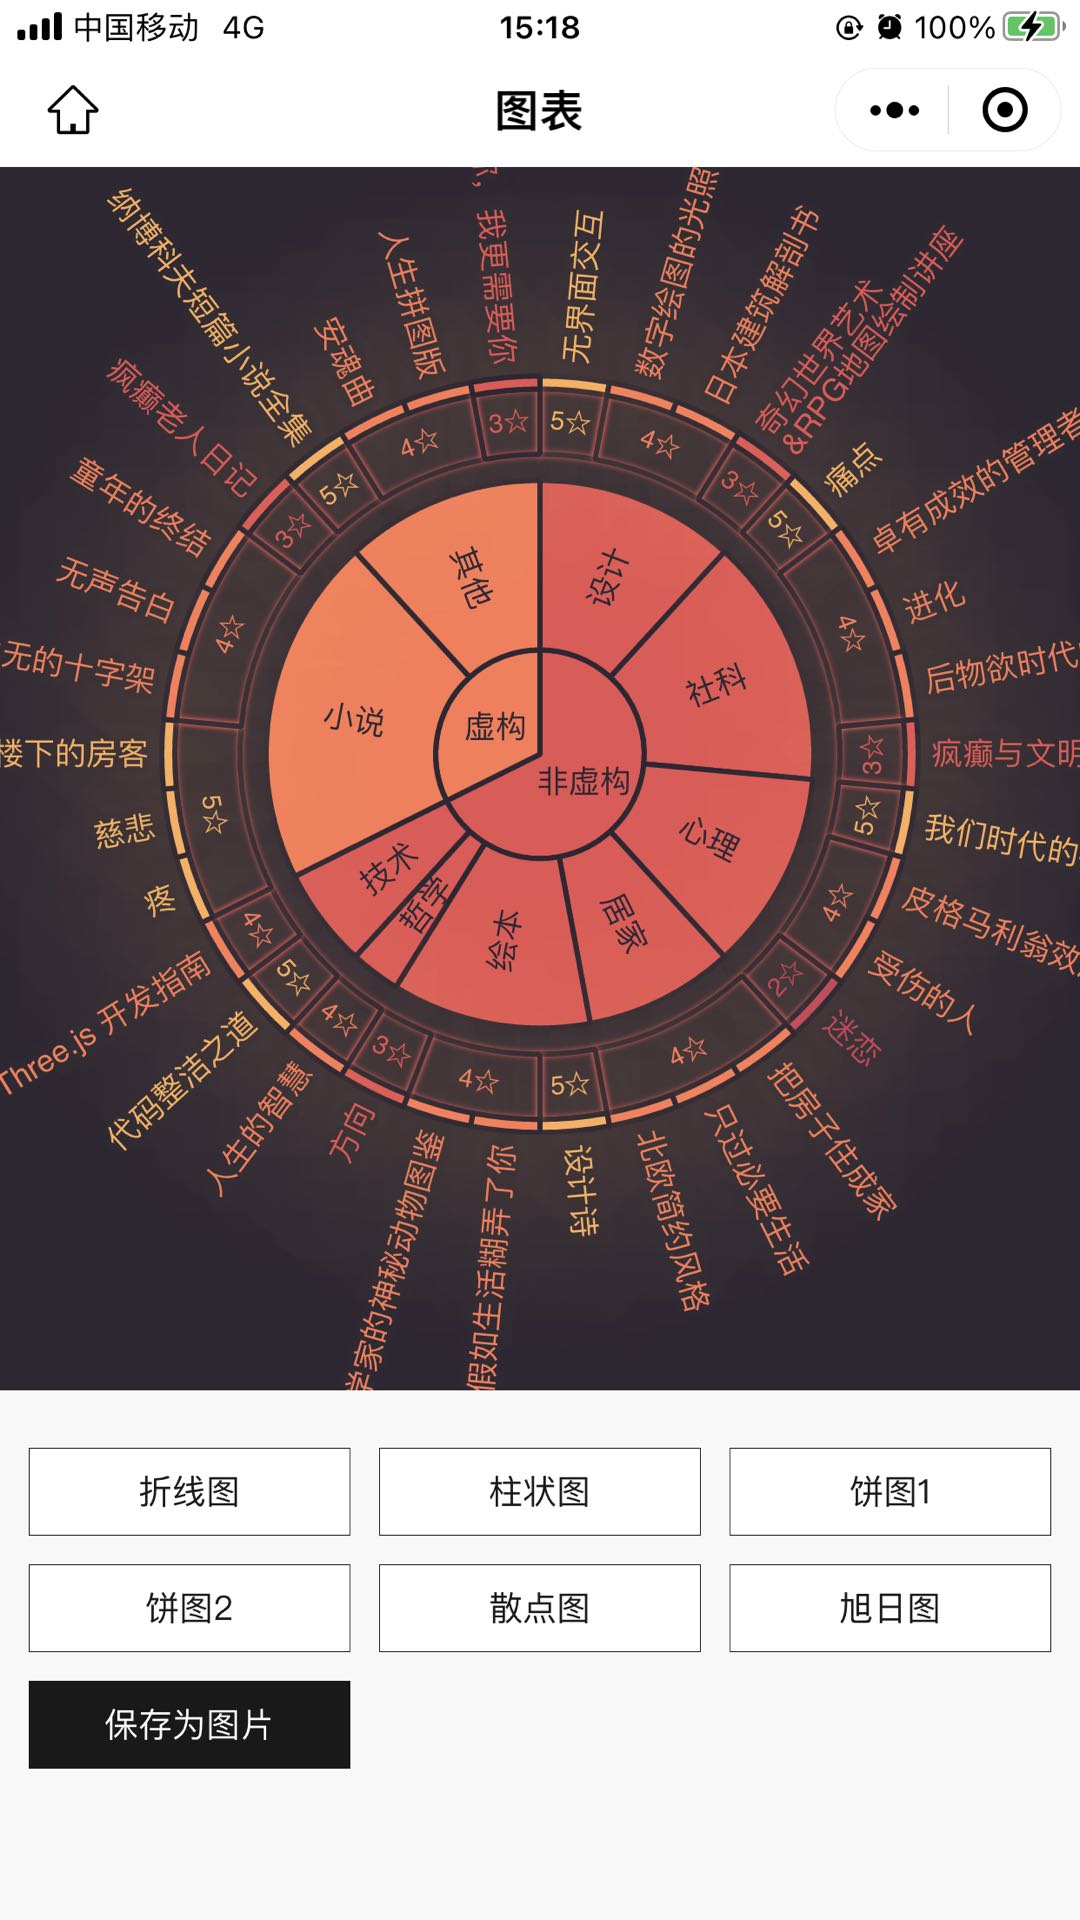
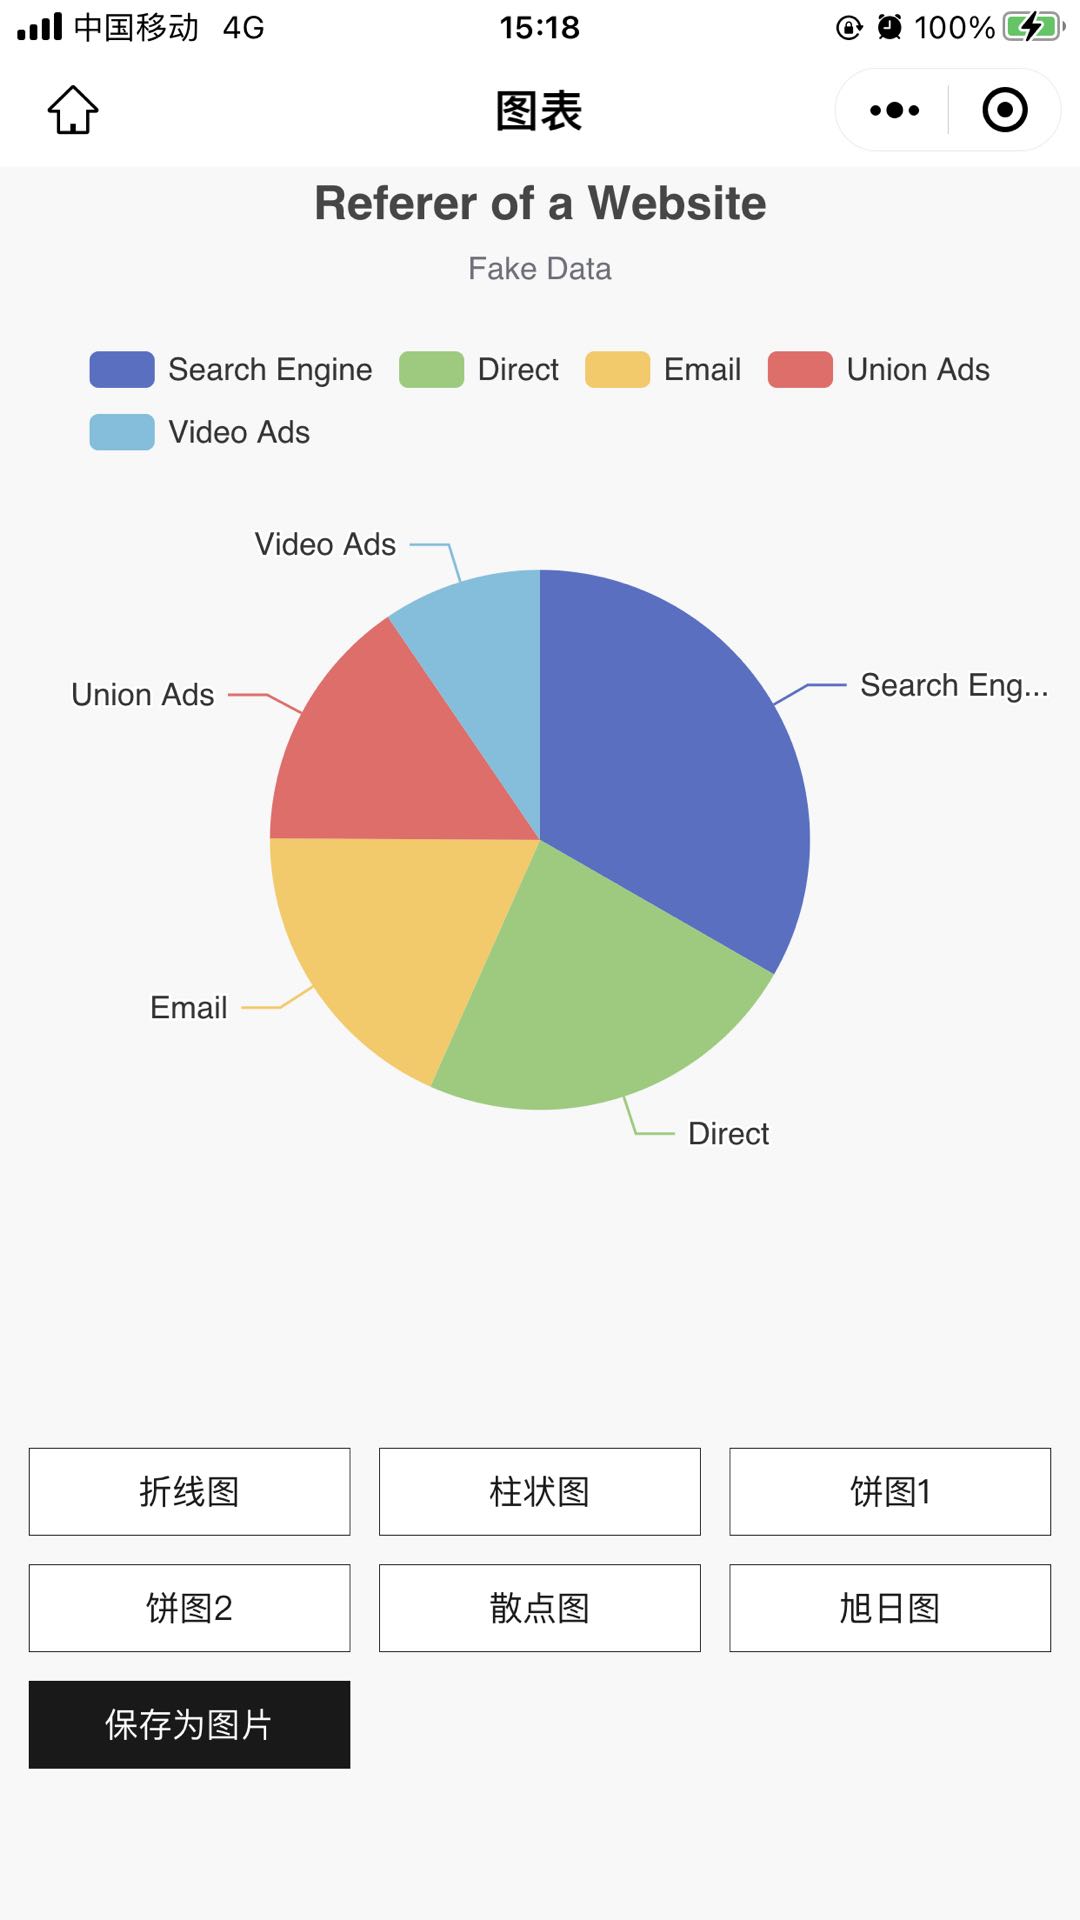
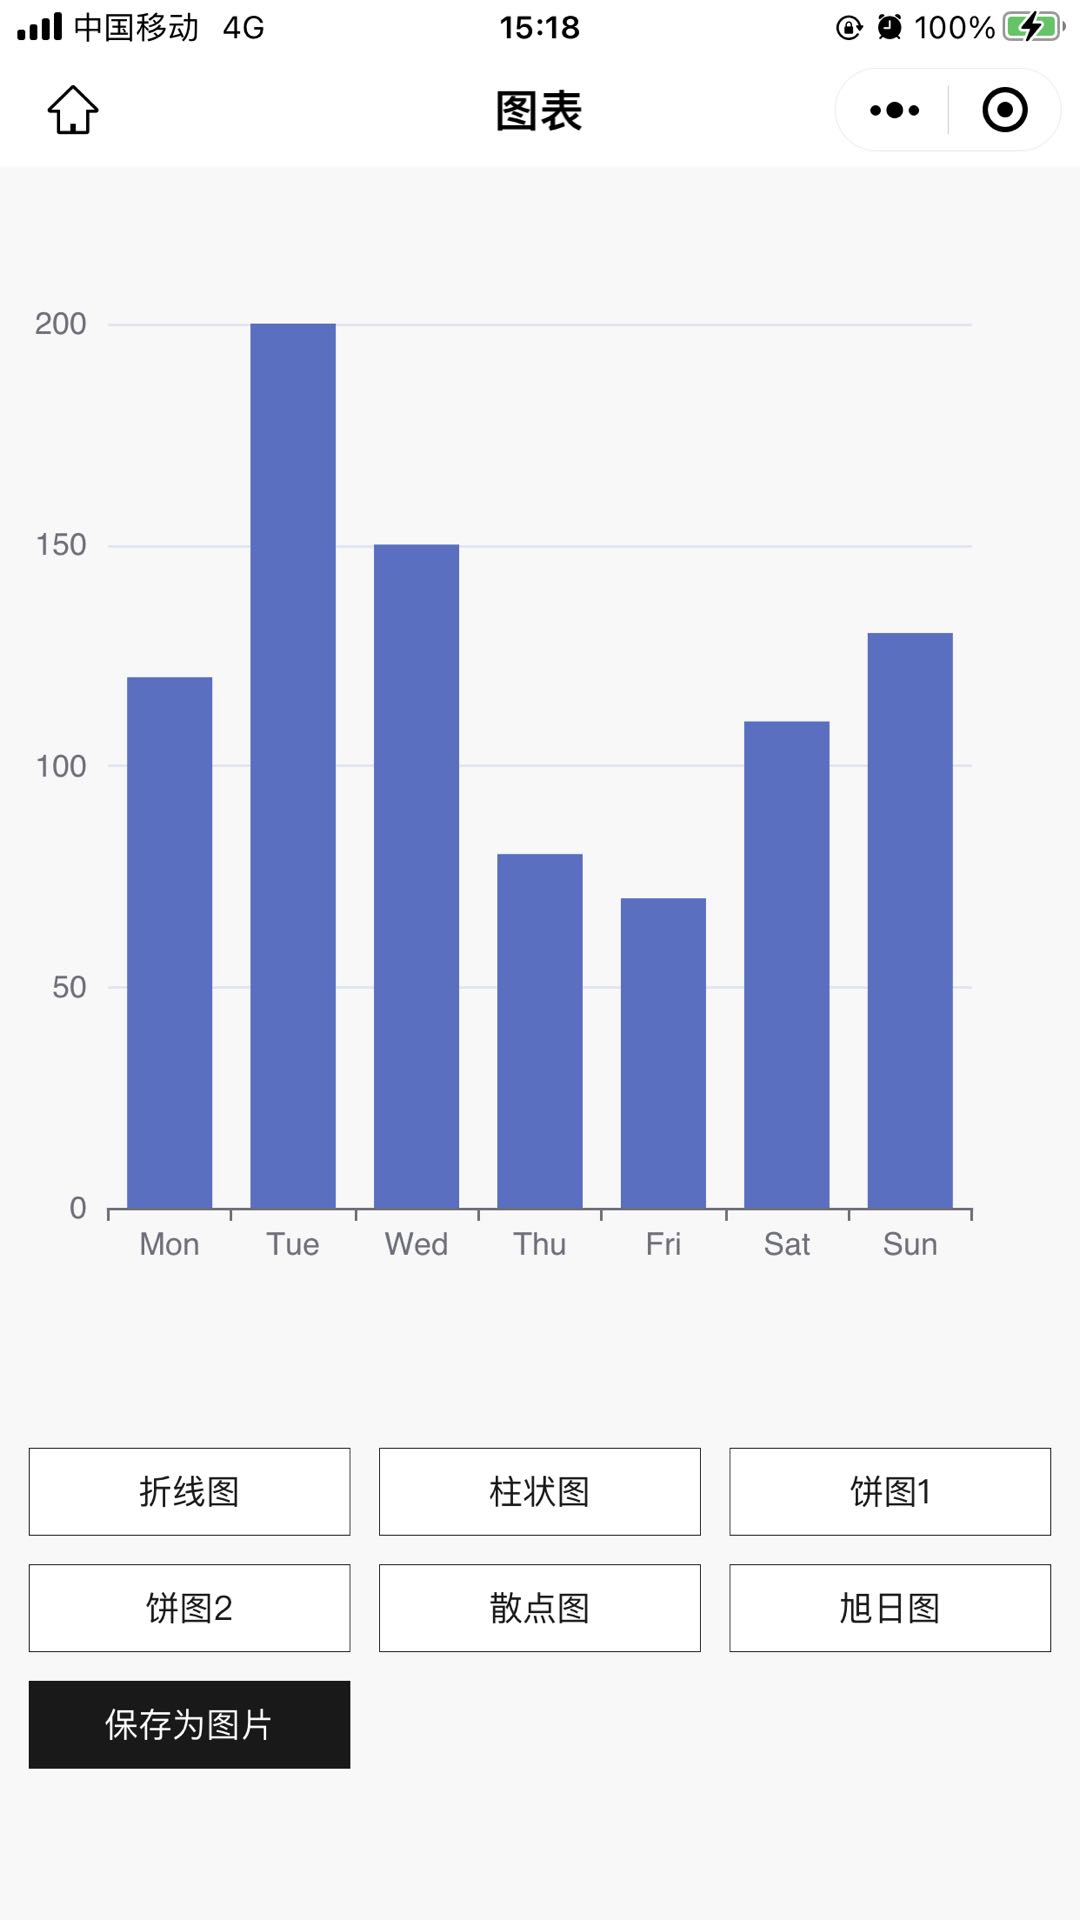
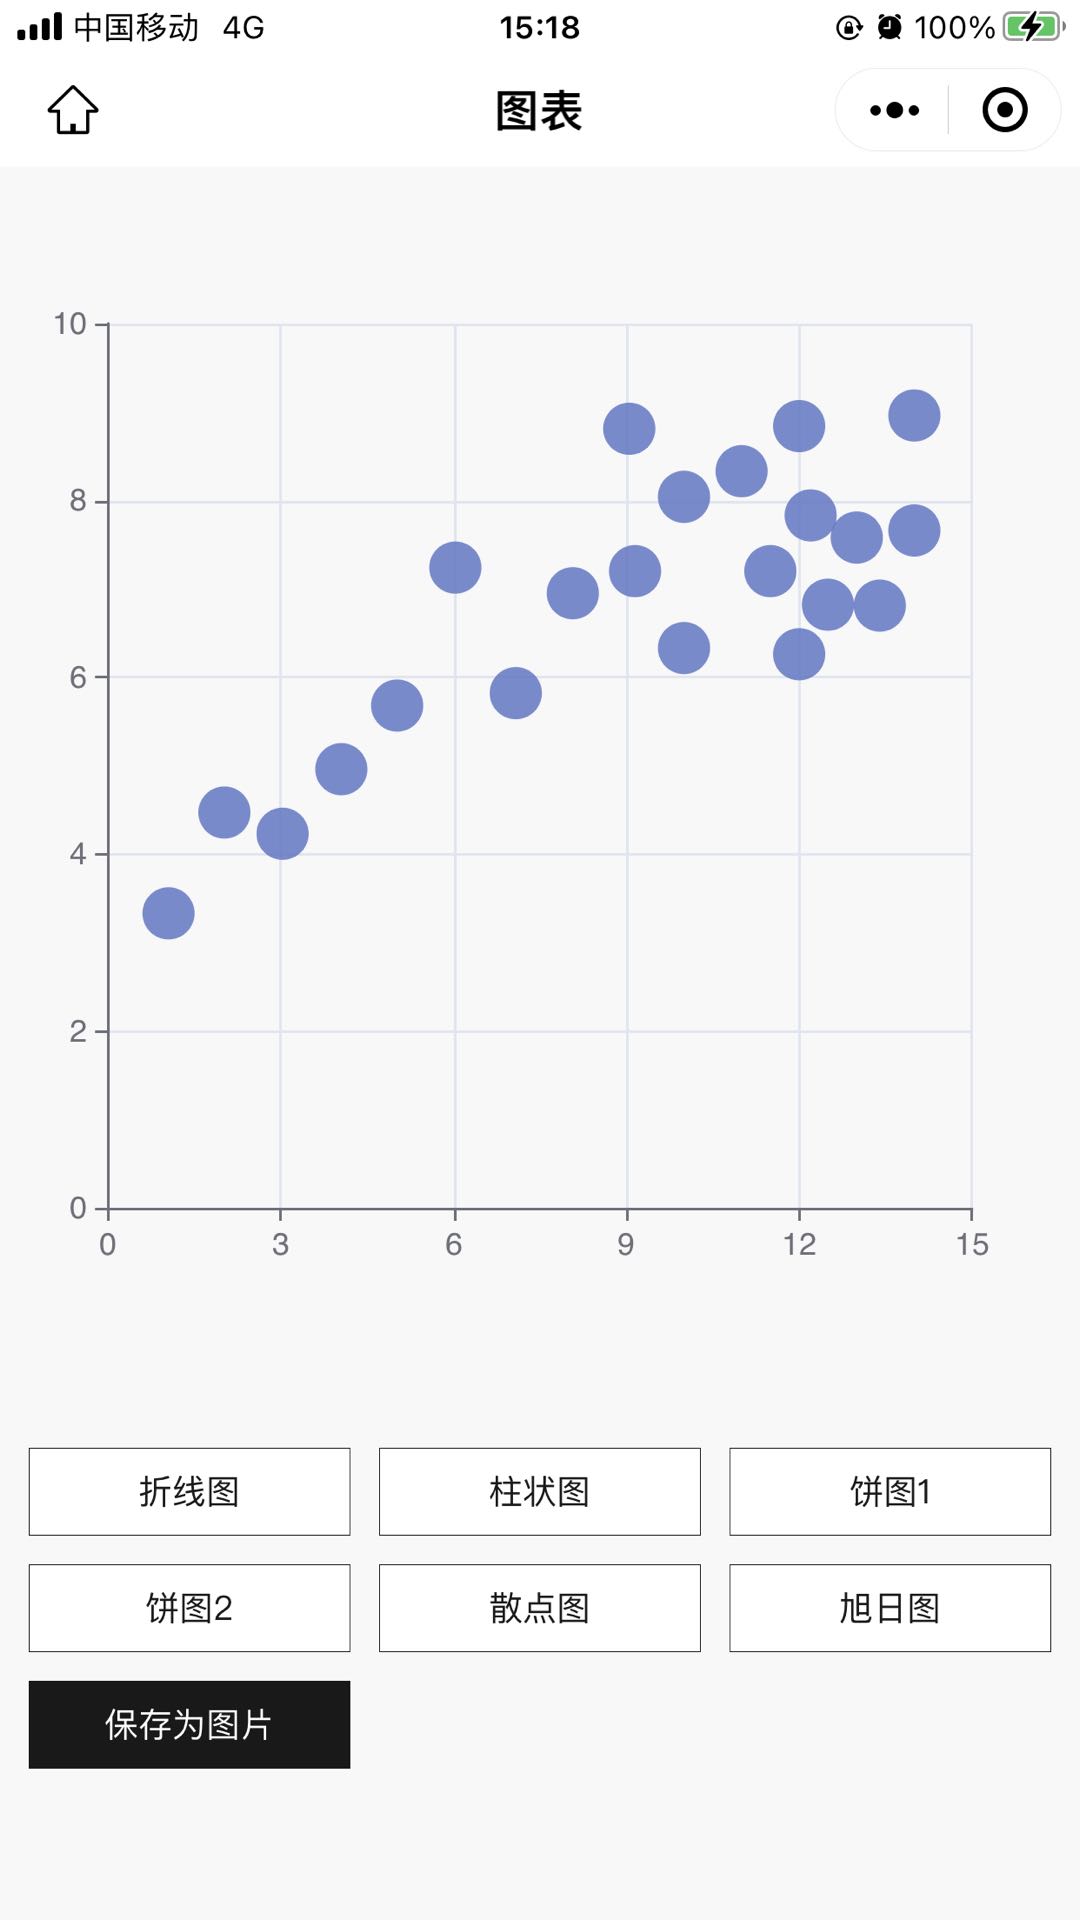
基于uni-app ts, 封装echarts库,适配H5端微信小程序端,其它端未测试,支持按需引入,支持导出为图片。
1、安装项目依赖 [tslib zrender是使用echarts必须额外安装的依赖]
npm install tslib zrender echarts lodash -S
2、将下载插件中components下的com-echarts文件夹复制到项目components目录下
3、在需要用到的页面引入该组件
<template>
  <!-- 页面使用 -->
  <com-echarts ref="echartsRef" height="850rpx" :chartList="chartList" :options="options"></com-echarts>
  ...
<template>
<script setup lang="ts">
  // 引入ref
  import { ref } from 'vue'

  // 按需引入chart
  import { PieChart, BarChart } from 'echarts/charts'

  // 引入组件
  import comEcharts from '[XXXXX]/components/com-echarts/com-echarts.vue'
  ...

  const chartList = [PieChart, BarChart]
  const chartsRef = ref()
  const options = ref({
    tooltip: {
      trigger: 'item'
    },
    legend: {
      top: '5%',
      left: 'center'
    },
    series: [
      {
        name: 'Access From',
        type: 'pie',
        radius: ['40%', '70%'],
        avoidLabelOverlap: false,
        itemStyle: {
          borderRadius: 10,
          borderColor: '#fff',
          borderWidth: 2
        },
        label: {
          show: false,
          position: 'center'
        },
        emphasis: {
          label: {
            show: true,
            fontSize: 40,
            fontWeight: 'bold'
          }
        },
        labelLine: {
          show: false
        },
        data: [
          { value: 1048, name: 'Search Engine' },
          { value: 735, name: 'Direct' },
          { value: 580, name: 'Email' },
          { value: 484, name: 'Union Ads' },
          { value: 300, name: 'Video Ads' }
        ]
      }
    ]
  })

  // 刷新
  const refresh = () => {
    chartsRef.value?.reStore()
  }

  // 导出为图片
  const saveImg = () => {
    chartsRef.value?.saveImage()
  }

</script>
4、组件props 及实例方法
4.1、props
| 参数 |
类型 |
必填 |
默认值 |
说明 |
| canvasId |
string |
否 |
'com-echarts-canvas' |
canvas id |
| chartList |
array |
是 |
[ ] |
从echarts/chart按需引入的chart列表 |
| options |
object |
是 |
无 |
图表数据配置 |
| width |
string |
否 |
100% |
图表宽度 |
| height |
string |
否 |
1000rpx |
图表高度 |
4.2、实例方法
| 实例方法 |
说明 |
| reStore |
重绘图表 |
| saveImage |
导出图片 |


 收藏人数:
收藏人数:
 下载插件并导入HBuilderX
 赞赏(0)
赞赏(0)
 下载 219
 赞赏 0
赞赏 0

 下载 9453041
 赞赏 1456


 赞赏
赞赏

 京公网安备:11010802035340号